The equations for Net Income (NI, also known as Earnings or Net Profit After Tax) and Cash Flow From Assets (CFFA, also known as Free Cash Flow to the Firm) per year are:
###NI=(Rev-COGS-FC-Depr-IntExp).(1-t_c)###
###CFFA=NI+Depr-CapEx - \varDelta NWC+IntExp###
For a firm with debt, what is the amount of the interest tax shield per year?
Stock A and B's returns have a correlation of 0.3. Which statement is NOT correct?
A company increases the proportion of debt funding it uses to finance its assets by issuing bonds and using the cash to repurchase stock, leaving assets unchanged.
Ignoring the costs of financial distress, which of the following statements is NOT correct:
Question 494 franking credit, personal tax on dividends, imputation tax system
A firm pays a fully franked cash dividend of $100 to one of its Australian shareholders who has a personal marginal tax rate of 15%. The corporate tax rate is 30%.
What will be the shareholder's personal tax payable due to the dividend payment?
Which of the following statements about call options is NOT correct?
A share’s current price is $60. It’s expected to pay a dividend of $1.50 in one year. The growth rate of the dividend is 0.5% pa and the stock’s required total return is 3% pa. The stock’s price can be modeled using the dividend discount model (DDM):
##P_0=\dfrac{C_1}{r-g}##
Which of the following methods is NOT equal to the stock’s expected price in one year and six months (t=1.5 years)? Note that the symbolic formulas shown in each line below do equal the formulas with numbers. The formula is just repeated with symbols and then numbers in case it helps you to identify the incorrect statement more quickly.
Question 784 boot strapping zero coupon yield, forward interest rate, term structure of interest rates
Information about three risk free Government bonds is given in the table below.
| Federal Treasury Bond Data | ||||
| Maturity | Yield to maturity | Coupon rate | Face value | Price |
| (years) | (pa, compounding annually) | (pa, paid annually) | ($) | ($) |
| 1 | 0% | 2% | 100 | 102 |
| 2 | 1% | 2% | 100 | 101.9703951 |
| 3 | 2% | 2% | 100 | 100 |
Based on the above government bonds' yields to maturity, which of the below statements about the spot zero rates and forward zero rates is NOT correct?
Question 882 Asian currency crisis, foreign exchange rate, original sin, no explanation
In the 1997 Asian currency crisis, the businesses most vulnerable to bankruptcy were those that:
Question 889 cross currency interest rate parity, no explanation
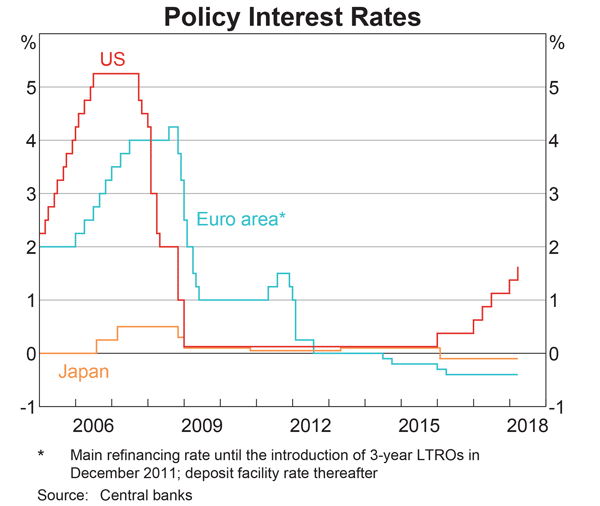
Judging by the graph, in 2018 the USD short term interest rate set by the US Federal Reserve is higher than the JPY short term interest rate set by the Bank of Japan, which is higher than the EUR short term interest rate set by the European central bank.

At the latest date shown in 2018: ##r_{USD}>r_{JPY}>r_{EUR}##
Assume that each currency’s yield curve is flat at the latest date shown in 2018, so interest rates are expected to remain at their current level into the future.
Which of the following statements is NOT correct?
Over time you would expect the:
Question 928 mean and median returns, mode return, return distribution, arithmetic and geometric averages, continuously compounding rate, no explanation
The arithmetic average continuously compounded or log gross discrete return (AALGDR) on the ASX200 accumulation index over the 24 years from 31 Dec 1992 to 31 Dec 2016 is 9.49% pa.
The arithmetic standard deviation (SDLGDR) is 16.92 percentage points pa.
Assume that the log gross discrete returns are normally distributed and that the above estimates are true population statistics, not sample statistics, so there is no standard error in the sample mean or standard deviation estimates. Also assume that the standardised normal Z-statistic corresponding to a one-tail probability of 2.5% is exactly -1.96.
If you had a $1 million fund that replicated the ASX200 accumulation index, in how many years would the mode dollar value of your fund first be expected to lie outside the 95% confidence interval forecast?
Note that the mode of a log-normally distributed future price is: ##P_{T \text{ mode}} = P_0.e^{(\text{AALGDR} - \text{SDLGDR}^2 ).T} ##