For a price of $10.20 each, Renee will sell you 100 shares. Each share is expected to pay dividends in perpetuity, growing at a rate of 5% pa. The next dividend is one year away (t=1) and is expected to be $1 per share.
The required return of the stock is 15% pa.
Stock A and B's returns have a correlation of 0.3. Which statement is NOT correct?
The equations for Net Income (NI, also known as Earnings or Net Profit After Tax) and Cash Flow From Assets (CFFA, also known as Free Cash Flow to the Firm) per year are:
###NI=(Rev-COGS-FC-Depr-IntExp).(1-t_c)###
###CFFA=NI+Depr-CapEx - \varDelta NWC+IntExp###
For a firm with debt, what is the formula for the present value of interest tax shields if the tax shields occur in perpetuity?
You may assume:
- the value of debt (D) is constant through time,
- The cost of debt and the yield on debt are equal and given by ##r_D##.
- the appropriate rate to discount interest tax shields is ##r_D##.
- ##\text{IntExp}=D.r_D##
The US firm Google operates in the online advertising business. In 2011 Google bought Motorola Mobility which manufactures mobile phones.
Assume the following:
- Google had a 10% after-tax weighted average cost of capital (WACC) before it bought Motorola.
- Motorola had a 20% after-tax WACC before it merged with Google.
- Google and Motorola have the same level of gearing.
- Both companies operate in a classical tax system.
You are a manager at Motorola. You must value a project for making mobile phones. Which method(s) will give the correct valuation of the mobile phone manufacturing project? Select the most correct answer.
The mobile phone manufacturing project's:
The following equation is the Dividend Discount Model, also known as the 'Gordon Growth Model' or the 'Perpetuity with growth' equation.
###P_0=\frac{d_1}{r-g}###
A stock pays dividends annually. It just paid a dividend, but the next dividend (##d_1##) will be paid in one year.
According to the DDM, what is the correct formula for the expected price of the stock in 2.5 years?
In the dividend discount model:
### P_0= \frac{d_1}{r-g} ###
The pronumeral ##g## is supposed to be the:
Over the next year, the management of an unlevered company plans to:
- Achieve firm free cash flow (FFCF or CFFA) of $1m.
- Pay dividends of $1.8m
- Complete a $1.3m share buy-back.
- Spend $0.8m on new buildings without buying or selling any other fixed assets. This capital expenditure is included in the CFFA figure quoted above.
Assume that:
- All amounts are received and paid at the end of the year so you can ignore the time value of money.
- The firm has sufficient retained profits to pay the dividend and complete the buy back.
- The firm plans to run a very tight ship, with no excess cash above operating requirements currently or over the next year.
How much new equity financing will the company need? In other words, what is the value of new shares that will need to be issued?
The below screenshot of Commonwealth Bank of Australia's (CBA) details were taken from the Google Finance website on 7 Nov 2014. Some information has been deliberately blanked out.
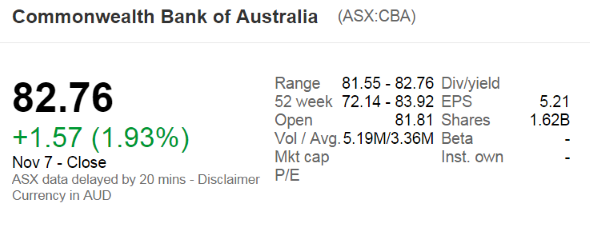
What was CBA's backwards-looking price-earnings ratio?
Estimate the French bank Societe Generale's share price using a backward-looking price earnings (PE) multiples approach with the following assumptions and figures only. Note that EUR is the euro, the European monetary union's currency.
- The 4 major European banks Credit Agricole (ACA), Deutsche Bank AG (DBK), UniCredit (UCG) and Banco Santander (SAN) are comparable companies to Societe Generale (GLE);
- Societe Generale's (GLE's) historical earnings per share (EPS) is EUR 2.92;
- ACA's backward-looking PE ratio is 16.29 and historical EPS is EUR 0.84;
- DBK's backward-looking PE ratio is 25.01 and historical EPS is EUR 1.26;
- SAN's backward-looking PE ratio is 14.71 and historical EPS is EUR 0.47;
- UCG's backward-looking PE ratio is 15.78 and historical EPS is EUR 0.40;
Note: Figures sourced from Google Finance on 27 March 2015.