Which statement(s) are correct?
(i) All stocks that plot on the Security Market Line (SML) are fairly priced.
(ii) All stocks that plot above the Security Market Line (SML) are overpriced.
(iii) All fairly priced stocks that plot on the Capital Market Line (CML) have zero idiosyncratic risk.
Select the most correct response:
The security market line (SML) shows the relationship between beta and expected return.
Buying investment projects that plot above the SML would lead to:
All things remaining equal, the variance of a portfolio of two positively-weighted stocks rises as:
Which of the following investable assets are NOT suitable for valuation using PE multiples techniques?
Your friend is trying to find the net present value of an investment which:
- Costs $1 million initially (t=0); and
- Pays a single positive cash flow of $1.1 million in one year (t=1).
The investment has a total required return of 10% pa due to its moderate level of undiversifiable risk.
Your friend is aware of the importance of opportunity costs and the time value of money, but he is unsure of how to find the NPV of the project.
He knows that the opportunity cost of investing the $1m in the project is the expected gain from investing the money in shares instead. Like the project, shares also have an expected return of 10% since they have moderate undiversifiable risk. This opportunity cost is $0.1m ##(=1m \times 10\%)## which occurs in one year (t=1).
He knows that the time value of money should be accounted for, and this can be done by finding the present value of the cash flows in one year.
Your friend has listed a few different ways to find the NPV which are written down below.
Method 1: ##-1m + \dfrac{1.1m}{(1+0.1)^1} ##
Method 2: ##-1m + 1.1m - 1m \times 0.1 ##
Method 3: ##-1m + \dfrac{1.1m}{(1+0.1)^1} - 1m \times 0.1 ##
Which of the above calculations give the correct NPV? Select the most correct answer.
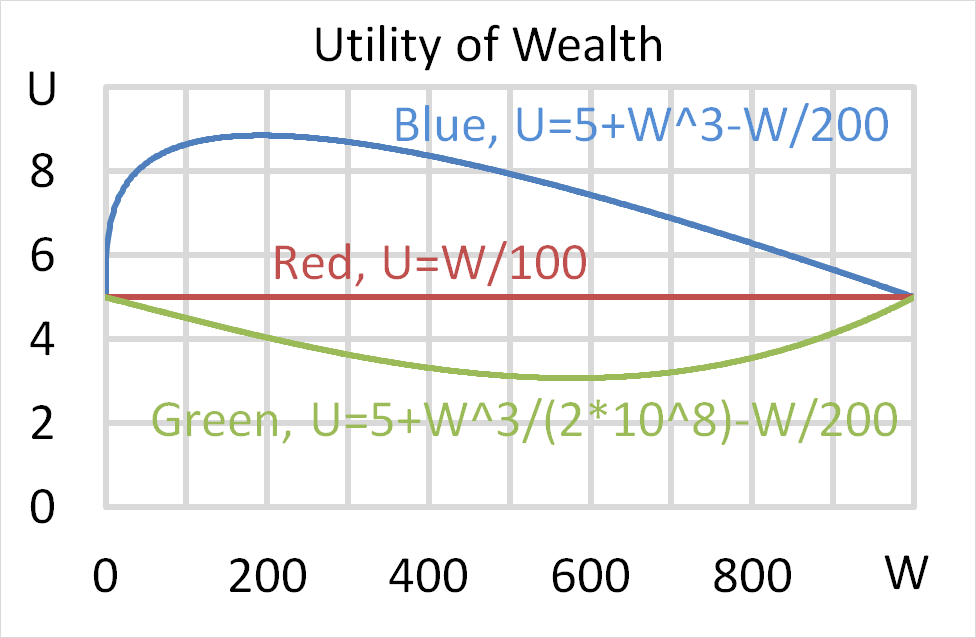
Mr Blue, Miss Red and Mrs Green are people with different utility functions.
Which of the following statements is NOT correct?
Question 883 monetary policy, impossible trinity, foreign exchange rate
It’s often thought that the ideal currency or exchange rate regime would:
1. Be fixed against the USD;
2. Be convertible to and from USD for traders and investors so there are open goods, services and capital markets, and;
3. Allow independent monetary policy set by the country’s central bank, independent of the US central bank. So the country can set its own interest rate independent of the US Federal Reserve’s USD interest rate.
However, not all of these characteristics can be achieved. One must be sacrificed. This is the 'impossible trinity'.
Which of the following exchange rate regimes sacrifices convertibility?
Question 921 utility, return distribution, log-normal distribution, arithmetic and geometric averages, no explanation
Who was the first theorist to propose the idea of ‘expected utility’?
Question 928 mean and median returns, mode return, return distribution, arithmetic and geometric averages, continuously compounding rate, no explanation
The arithmetic average continuously compounded or log gross discrete return (AALGDR) on the ASX200 accumulation index over the 24 years from 31 Dec 1992 to 31 Dec 2016 is 9.49% pa.
The arithmetic standard deviation (SDLGDR) is 16.92 percentage points pa.
Assume that the log gross discrete returns are normally distributed and that the above estimates are true population statistics, not sample statistics, so there is no standard error in the sample mean or standard deviation estimates. Also assume that the standardised normal Z-statistic corresponding to a one-tail probability of 2.5% is exactly -1.96.
If you had a $1 million fund that replicated the ASX200 accumulation index, in how many years would the mode dollar value of your fund first be expected to lie outside the 95% confidence interval forecast?
Note that the mode of a log-normally distributed future price is: ##P_{T \text{ mode}} = P_0.e^{(\text{AALGDR} - \text{SDLGDR}^2 ).T} ##
A stock's returns are normally distributed with a mean of 8% pa and a standard deviation of 15 percentage points pa. What is the 99% confidence interval of returns over the next year? Note that the Z-statistic corresponding to a one-tail:
- 90% normal probability density function is 1.282.
- 95% normal probability density function is 1.645.
- 97.5% normal probability density function is 1.960.
- 99% normal probability density function is 2.326.
- 99.5% normal probability density function is 2.576
The 99% confidence interval of annual returns is between: