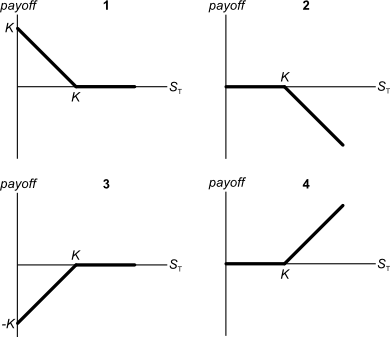
Below are 4 option graphs. Note that the y-axis is payoff at maturity (T). What options do they depict? List them in the order that they are numbered.
A highly levered risky firm is trying to raise more debt. The types of debt being considered, in no particular order, are senior bonds, junior bonds, bank accepted bills, promissory notes and bank loans.
Which of these forms of debt is the safest from the perspective of the debt investors who are thinking of investing in the firm's new debt?
Question 345 capital budgeting, break even, NPV
| Project Data | ||
| Project life | 10 yrs | |
| Initial investment in factory | $10m | |
| Depreciation of factory per year | $1m | |
| Expected scrap value of factory at end of project | $0 | |
| Sale price per unit | $10 | |
| Variable cost per unit | $6 | |
| Fixed costs per year, paid at the end of each year | $2m | |
| Interest expense per year | 0 | |
| Tax rate | 30% | |
| Cost of capital per annum | 10% | |
Notes
- The firm's current liabilities are forecast to stay at $0.5m. The firm's current assets (mostly inventory) is currently $1m, but is forecast to grow by $0.1m at the end of each year due to the project.
At the end of the project, the current assets accumulated due to the project can be sold for the same price that they were bought. - A marketing survey was used to forecast sales. It cost $1.4m which was just paid. The cost has been capitalised by the accountants and is tax-deductible over the life of the project, regardless of whether the project goes ahead or not. This amortisation expense is not included in the depreciation expense listed in the table above.
Assumptions
- All cash flows occur at the start or end of the year as appropriate, not in the middle or throughout the year.
- All rates and cash flows are real. The inflation rate is 3% pa.
- All rates are given as effective annual rates.
Find the break even unit production (Q) per year to achieve a zero Net Income (NI) and Net Present Value (NPV), respectively. The answers below are listed in the same order.
One formula for calculating a levered firm's free cash flow (FFCF, or CFFA) is to use net operating profit after tax (NOPAT).
###\begin{aligned} FFCF &= NOPAT + Depr - CapEx -\Delta NWC \\ &= (Rev - COGS - Depr - FC)(1-t_c) + Depr - CapEx -\Delta NWC \\ \end{aligned} \\###
Acquirer firm plans to launch a takeover of Target firm. The deal is expected to create a present value of synergies totaling $105 million. A 40% scrip and 60% cash offer will be made that pays the fair price for the target's shares plus 75% of the total synergy value. The cash will be paid out of the firm's cash holdings, no new debt or equity will be raised.
| Firms Involved in the Takeover | ||
| Acquirer | Target | |
| Assets ($m) | 6,000 | 700 |
| Debt ($m) | 4,800 | 400 |
| Share price ($) | 40 | 20 |
| Number of shares (m) | 30 | 15 |
Ignore transaction costs and fees. Assume that the firms' debt and equity are fairly priced, and that each firms' debts' risk, yield and values remain constant. The acquisition is planned to occur immediately, so ignore the time value of money.
Calculate the merged firm's share price and total number of shares after the takeover has been completed.
The expression 'cash is king' emphasizes the importance of having enough cash to pay your short term debts to avoid bankruptcy. Which business decision is this expression most closely related to?
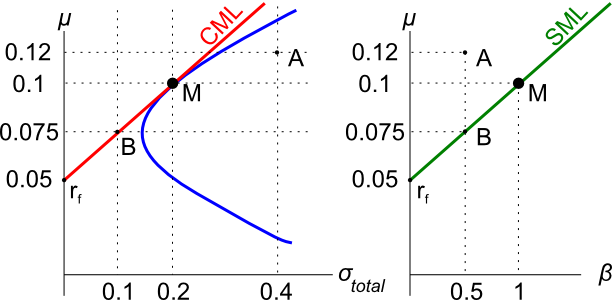
Assets A, B, M and ##r_f## are shown on the graphs above. Asset M is the market portfolio and ##r_f## is the risk free yield on government bonds. Which of the below statements is NOT correct?
Which of the following is NOT a valid method for estimating the beta of a company's stock? Assume that markets are efficient, a long history of past data is available, the stock possesses idiosyncratic and market risk. The variances and standard deviations below denote total risks.
Question 723 mean and median returns, return distribution, arithmetic and geometric averages, continuously compounding rate
Here is a table of stock prices and returns. Which of the statements below the table is NOT correct?
| Price and Return Population Statistics | ||||
| Time | Prices | LGDR | GDR | NDR |
| 0 | 100 | |||
| 1 | 99 | -0.010050 | 0.990000 | -0.010000 |
| 2 | 180.40 | 0.600057 | 1.822222 | 0.822222 |
| 3 | 112.73 | 0.470181 | 0.624889 | 0.375111 |
| Arithmetic average | 0.0399 | 1.1457 | 0.1457 | |
| Arithmetic standard deviation | 0.4384 | 0.5011 | 0.5011 | |
Use the below information to value a levered company with constant annual perpetual cash flows from assets. The next cash flow will be generated in one year from now, so a perpetuity can be used to value this firm. Both the operating and firm free cash flows are constant (but not equal to each other).
| Data on a Levered Firm with Perpetual Cash Flows | ||
| Item abbreviation | Value | Item full name |
| ##\text{OFCF}## | $100m | Operating free cash flow |
| ##\text{FFCF or CFFA}## | $112m | Firm free cash flow or cash flow from assets (includes interest tax shields) |
| ##g## | 0% pa | Growth rate of OFCF and FFCF |
| ##\text{WACC}_\text{BeforeTax}## | 7% pa | Weighted average cost of capital before tax |
| ##\text{WACC}_\text{AfterTax}## | 6.25% pa | Weighted average cost of capital after tax |
| ##r_\text{D}## | 5% pa | Cost of debt |
| ##r_\text{EL}## | 9% pa | Cost of levered equity |
| ##D/V_L## | 50% pa | Debt to assets ratio, where the asset value includes tax shields |
| ##t_c## | 30% | Corporate tax rate |
What is the value of the levered firm including interest tax shields?