A project has an internal rate of return (IRR) which is greater than its required return. Select the most correct statement.
A 30 year Japanese government bond was just issued at par with a yield of 1.7% pa. The fixed coupon payments are semi-annual. The bond has a face value of $100.
Six months later, just after the first coupon is paid, the yield of the bond increases to 2% pa. What is the bond's new price?
Estimate the US bank JP Morgan's share price using a price earnings (PE) multiples approach with the following assumptions and figures only:
- The major US banks JP Morgan Chase (JPM), Citi Group (C) and Wells Fargo (WFC) are comparable companies;
- JP Morgan Chase's historical earnings per share (EPS) is $4.37;
- Citi Group's share price is $50.05 and historical EPS is $4.26;
- Wells Fargo's share price is $48.98 and historical EPS is $3.89.
Note: Figures sourced from Google Finance on 24 March 2014.
A method commonly seen in textbooks for calculating a levered firm's free cash flow (FFCF, or CFFA) is the following:
###\begin{aligned} FFCF &= (Rev - COGS - Depr - FC - IntExp)(1-t_c) + \\ &\space\space\space+ Depr - CapEx -\Delta NWC + IntExp(1-t_c) \\ \end{aligned}###
The below three graphs show probability density functions (PDF) of three different random variables Red, Green and Blue.
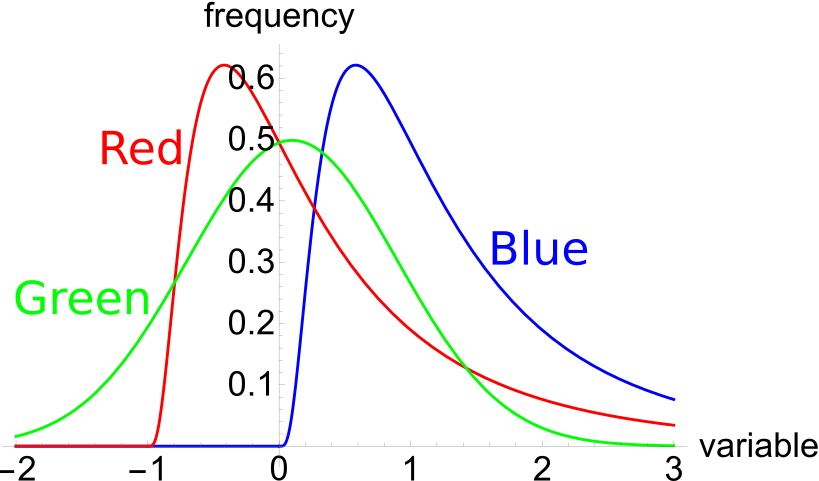
Which of the below statements is NOT correct?
Use the below information to value a levered company with constant annual perpetual cash flows from assets. The next cash flow will be generated in one year from now, so a perpetuity can be used to value this firm. Both the operating and firm free cash flows are constant (but not equal to each other).
| Data on a Levered Firm with Perpetual Cash Flows | ||
| Item abbreviation | Value | Item full name |
| ##\text{OFCF}## | $100m | Operating free cash flow |
| ##\text{FFCF or CFFA}## | $112m | Firm free cash flow or cash flow from assets (includes interest tax shields) |
| ##g## | 0% pa | Growth rate of OFCF and FFCF |
| ##\text{WACC}_\text{BeforeTax}## | 7% pa | Weighted average cost of capital before tax |
| ##\text{WACC}_\text{AfterTax}## | 6.25% pa | Weighted average cost of capital after tax |
| ##r_\text{D}## | 5% pa | Cost of debt |
| ##r_\text{EL}## | 9% pa | Cost of levered equity |
| ##D/V_L## | 50% pa | Debt to assets ratio, where the asset value includes tax shields |
| ##t_c## | 30% | Corporate tax rate |
What is the value of the levered firm including interest tax shields?
Question 948 VaR, expected shortfall
Below is a historical sample of returns on the S&P500 capital index.
| S&P500 Capital Index Daily Returns Ranked from Best to Worst |
||
| 10,000 trading days from 4th August 1977 to 24 March 2017 based on closing prices. |
||
| Rank | Date (DD-MM-YY) |
Continuously compounded daily return (% per day) |
| 1 | 21-10-87 | 9.23 |
| 2 | 08-03-83 | 8.97 |
| 3 | 13-11-08 | 8.3 |
| 4 | 30-09-08 | 8.09 |
| 5 | 28-10-08 | 8.01 |
| 6 | 29-10-87 | 7.28 |
| … | … | … |
| 9980 | 11-12-08 | -5.51 |
| 9981 | 22-10-08 | -5.51 |
| 9982 | 08-08-11 | -5.54 |
| 9983 | 22-09-08 | -5.64 |
| 9984 | 11-09-86 | -5.69 |
| 9985 | 30-11-87 | -5.88 |
| 9986 | 14-04-00 | -5.99 |
| 9987 | 07-10-98 | -6.06 |
| 9988 | 08-01-88 | -6.51 |
| 9989 | 27-10-97 | -6.55 |
| 9990 | 13-10-89 | -6.62 |
| 9991 | 15-10-08 | -6.71 |
| 9992 | 29-09-08 | -6.85 |
| 9993 | 07-10-08 | -6.91 |
| 9994 | 14-11-08 | -7.64 |
| 9995 | 01-12-08 | -7.79 |
| 9996 | 29-10-08 | -8.05 |
| 9997 | 26-10-87 | -8.4 |
| 9998 | 31-08-98 | -8.45 |
| 9999 | 09-10-08 | -12.9 |
| 10000 | 19-10-87 | -23.36 |
| Mean of all 10,000: | 0.0354 | |
| Sample standard deviation of all 10,000: | 1.2062 | |
| Sources: Bloomberg and S&P. | ||
Assume that the one-tail Z-statistic corresponding to a probability of 99.9% is exactly 3.09. Which of the following statements is NOT correct? Based on the historical data, the 99.9% daily: