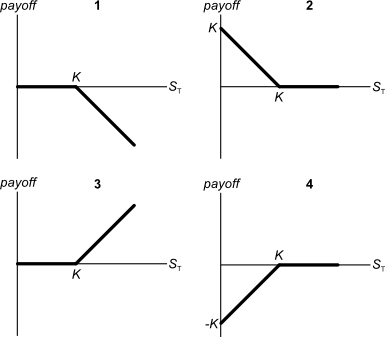
Below are 4 option graphs. Note that the y-axis is payoff at maturity (T). What options do they depict? List them in the order that they are numbered
A company announces that it will pay a dividend, as the market expected. The company's shares trade on the stock exchange which is open from 10am in the morning to 4pm in the afternoon each weekday. When would the share price be expected to fall by the amount of the dividend? Ignore taxes.
The share price is expected to fall during the:
A European put option will mature in ##T## years with a strike price of ##K## dollars. The underlying asset has a price of ##S## dollars.
What is an expression for the payoff at maturity ##(f_T)## in dollars from owning (being long) the put option?
Which of the following investable assets is the LEAST suitable for valuation using PE multiples techniques?
Question 419 capital budgeting, NPV, interest tax shield, WACC, CFFA, CAPM, no explanation
| Project Data | ||
| Project life | 1 year | |
| Initial investment in equipment | $6m | |
| Depreciation of equipment per year | $6m | |
| Expected sale price of equipment at end of project | 0 | |
| Unit sales per year | 9m | |
| Sale price per unit | $8 | |
| Variable cost per unit | $6 | |
| Fixed costs per year, paid at the end of each year | $1m | |
| Interest expense in first year (at t=1) | $0.53m | |
| Tax rate | 30% | |
| Government treasury bond yield | 5% | |
| Bank loan debt yield | 6% | |
| Market portfolio return | 10% | |
| Covariance of levered equity returns with market | 0.08 | |
| Variance of market portfolio returns | 0.16 | |
| Firm's and project's debt-to-assets ratio | 50% | |
Notes
- Due to the project, current assets will increase by $5m now (t=0) and fall by $5m at the end (t=1). Current liabilities will not be affected.
Assumptions
- The debt-to-assets ratio will be kept constant throughout the life of the project. The amount of interest expense at the end of each period has been correctly calculated to maintain this constant debt-to-equity ratio.
- Millions are represented by 'm'.
- All cash flows occur at the start or end of the year as appropriate, not in the middle or throughout the year.
- All rates and cash flows are real. The inflation rate is 2% pa.
- All rates are given as effective annual rates.
- The 50% capital gains tax discount is not available since the project is undertaken by a firm, not an individual.
What is the net present value (NPV) of the project?
Question 442 economic depreciation, no explanation
A fairly valued share's current price is $4 and it has a total required return of 30%. Dividends are paid annually and next year's dividend is expected to be $1. After that, dividends are expected to grow by 5% pa. All rates are effective annual returns.
What is the expected dividend cash flow, economic depreciation, and economic income and economic value added (EVA) that will be earned over the second year (from t=1 to t=2) and paid at the end of that year (t=2)?
Which of the following statements about yield curves is NOT correct?
A share’s current price is $60. It’s expected to pay a dividend of $1.50 in one year. The growth rate of the dividend is 0.5% pa and the stock’s required total return is 3% pa. The stock’s price can be modeled using the dividend discount model (DDM):
##P_0=\dfrac{C_1}{r-g}##
Which of the following methods is NOT equal to the stock’s expected price in one year and six months (t=1.5 years)? Note that the symbolic formulas shown in each line below do equal the formulas with numbers. The formula is just repeated with symbols and then numbers in case it helps you to identify the incorrect statement more quickly.
Question 823 option, option payoff at maturity, option profit, no explanation
A European call option should only be exercised if:
Question 968 foreign exchange rate, forward foreign exchange rate, cross currency interest rate parity, no explanation
Below is a graph showing the spread or difference between government bond yields in different countries compared to the US. Assume that all governments have zero credit risk.
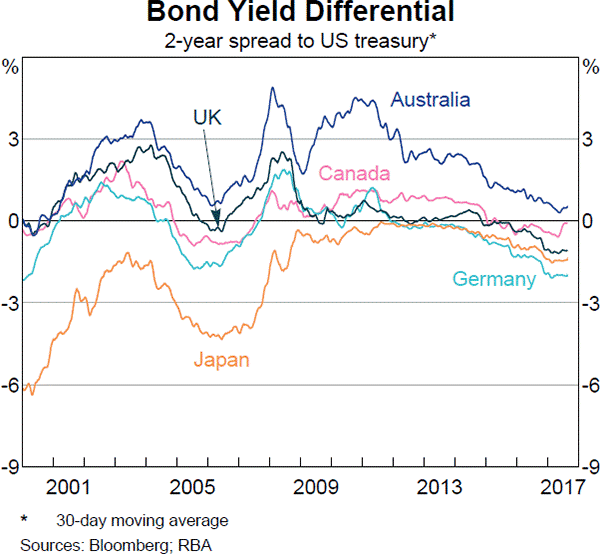
According to the principle of cross-currency interest rate parity, which country is likely to have the greatest expected currency appreciation against the USD over the next 2 years?