A stock, a call, a put and a bond are available to trade. The call and put options' underlying asset is the stock they and have the same strike prices, ##K_T##.
You are currently long the stock. You want to hedge your long stock position without actually trading the stock. How would you do this?
A one year European-style put option has a strike price of $4.
The option's underlying stock currently trades at $5, pays no dividends and its standard deviation of continuously compounded returns is 47% pa.
The risk-free interest rate is 10% pa continuously compounded.
Use the Black-Scholes-Merton formula to calculate the option price. The put option price now is:
Question 795 option, Black-Scholes-Merton option pricing, option delta, no explanation
Which of the following quantities from the Black-Scholes-Merton option pricing formula gives the Delta of a European put option?
Question 797 option, Black-Scholes-Merton option pricing, option delta, no explanation
Which of the following quantities from the Black-Scholes-Merton option pricing formula gives the risk-neutral probability that a European put option will be exercised?
Question 903 option, Black-Scholes-Merton option pricing, option on stock index
A six month European-style call option on the S&P500 stock index has a strike price of 2800 points.
The underlying S&P500 stock index currently trades at 2700 points, has a continuously compounded dividend yield of 2% pa and a standard deviation of continuously compounded returns of 25% pa.
The risk-free interest rate is 5% pa continuously compounded.
Use the Black-Scholes-Merton formula to calculate the option price. The call option price now is:
A stock is expected to pay its semi-annual dividend of $1 per share for the foreseeable future. The current stock price is $40 and the continuously compounded risk free rate is 3% pa for all maturities. An investor has just taken a long position in a 12-month futures contract on the stock. The last dividend payment was exactly 4 months ago. Therefore the next $1 dividend is in 2 months, and the $1 dividend after is 8 months from now. Which of the following statements about this scenario is NOT correct?
If a variable, say X, is normally distributed with mean ##\mu## and variance ##\sigma^2## then mathematicians write ##X \sim \mathcal{N}(\mu, \sigma^2)##.
If a variable, say Y, is log-normally distributed and the underlying normal distribution has mean ##\mu## and variance ##\sigma^2## then mathematicians write ## Y \sim \mathbf{ln} \mathcal{N}(\mu, \sigma^2)##.
The below three graphs show probability density functions (PDF) of three different random variables Red, Green and Blue.
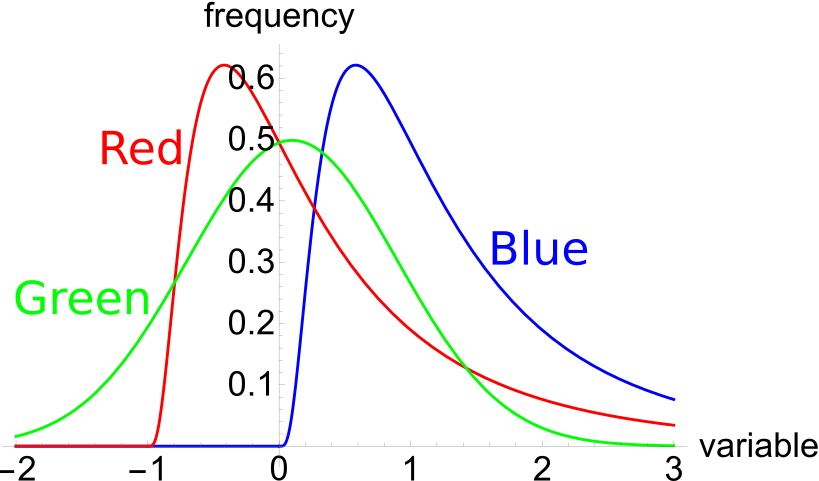
Select the most correct statement:
The below three graphs show probability density functions (PDF) of three different random variables Red, Green and Blue. Let ##P_1## be the unknown price of a stock in one year. ##P_1## is a random variable. Let ##P_0 = 1##, so the share price now is $1. This one dollar is a constant, it is not a variable.
Which of the below statements is NOT correct? Financial practitioners commonly assume that the shape of the PDF represented in the colour:
Question 719 mean and median returns, return distribution, arithmetic and geometric averages, continuously compounding rate
A stock has an arithmetic average continuously compounded return (AALGDR) of 10% pa, a standard deviation of continuously compounded returns (SDLGDR) of 80% pa and current stock price of $1. Assume that stock prices are log-normally distributed. The graph below summarises this information and provides some helpful formulas.
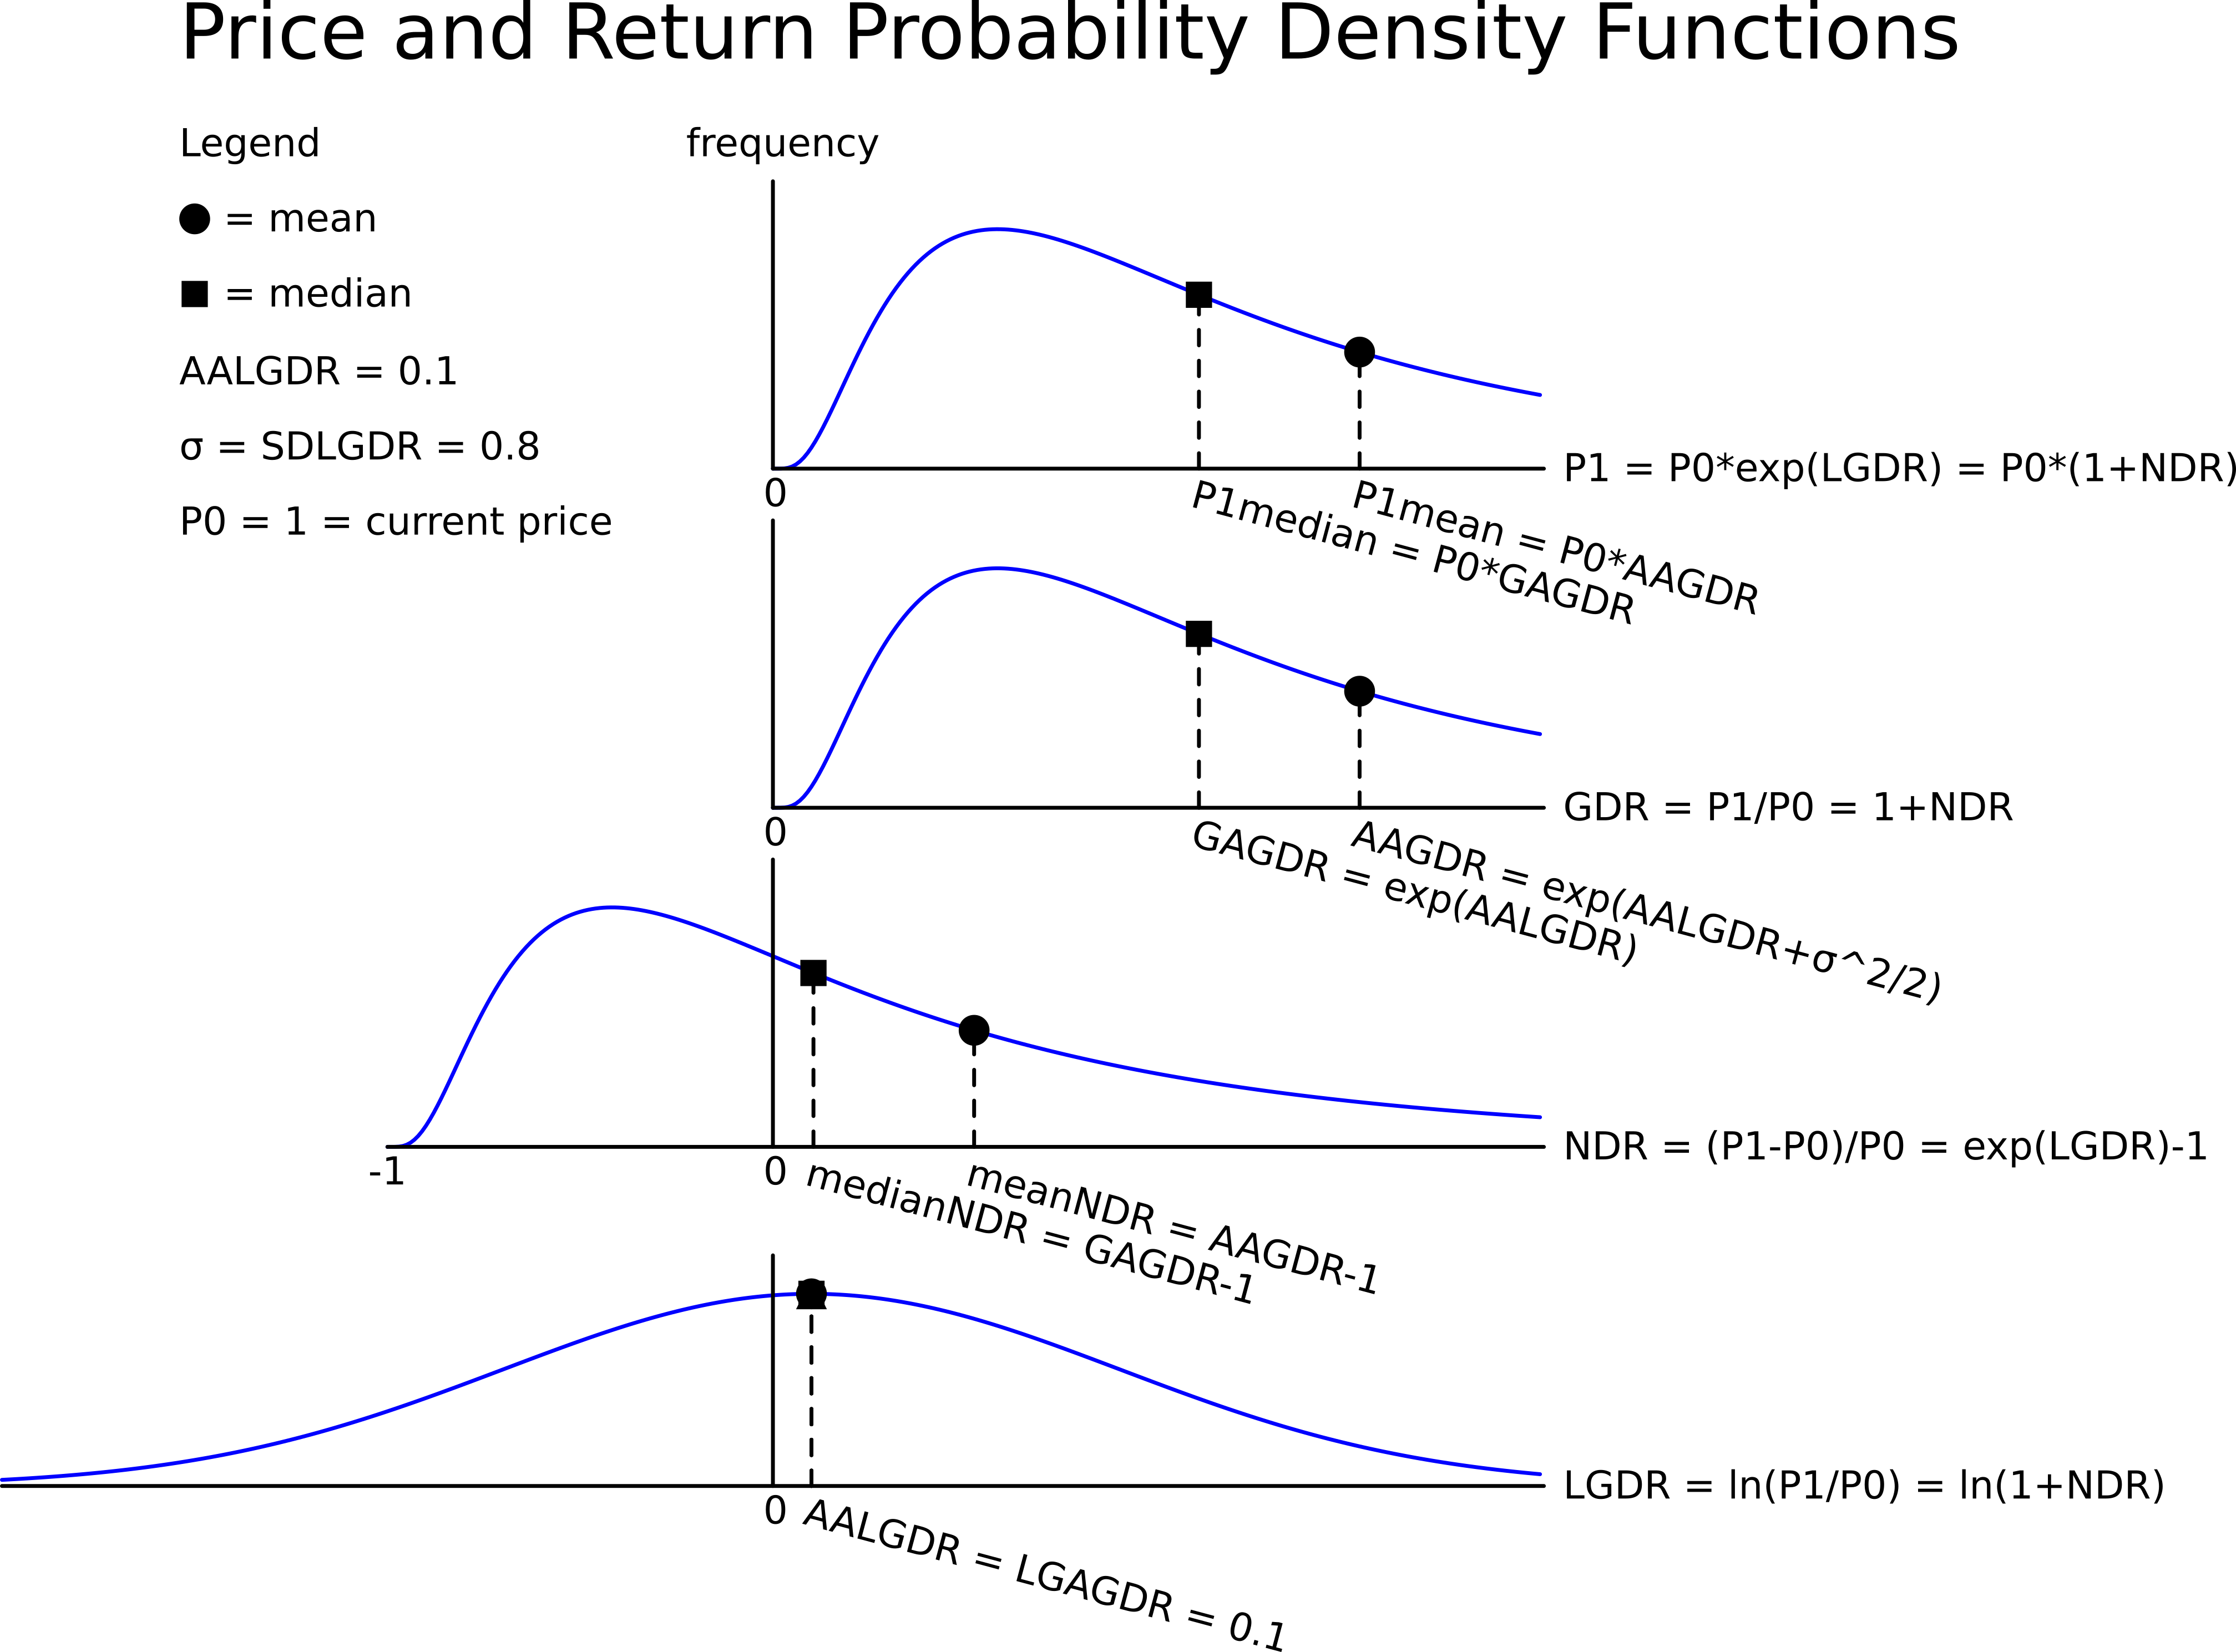
In one year, what do you expect the median and mean prices to be? The answer options are given in the same order.
Question 723 mean and median returns, return distribution, arithmetic and geometric averages, continuously compounding rate
Here is a table of stock prices and returns. Which of the statements below the table is NOT correct?
| Price and Return Population Statistics | ||||
| Time | Prices | LGDR | GDR | NDR |
| 0 | 100 | |||
| 1 | 99 | -0.010050 | 0.990000 | -0.010000 |
| 2 | 180.40 | 0.600057 | 1.822222 | 0.822222 |
| 3 | 112.73 | 0.470181 | 0.624889 | 0.375111 |
| Arithmetic average | 0.0399 | 1.1457 | 0.1457 | |
| Arithmetic standard deviation | 0.4384 | 0.5011 | 0.5011 | |
Which of the following quantities is commonly assumed to be normally distributed?
The below three graphs show probability density functions (PDF) of three different random variables Red, Green and Blue.
Which of the below statements is NOT correct?
The symbol ##\text{GDR}_{0\rightarrow 1}## represents a stock's gross discrete return per annum over the first year. ##\text{GDR}_{0\rightarrow 1} = P_1/P_0##. The subscript indicates the time period that the return is mentioned over. So for example, ##\text{AAGDR}_{1 \rightarrow 3}## is the arithmetic average GDR measured over the two year period from years 1 to 3, but it is expressed as a per annum rate.
Which of the below statements about the arithmetic and geometric average GDR is NOT correct?
The standard deviation of monthly changes in the spot price of corn is 50 cents per bushel. The standard deviation of monthly changes in the futures price of corn is 40 cents per bushel. The correlation between the spot price of corn and the futures price of corn is 0.9.
It is now March. A corn chip manufacturer is committed to buying 250,000 bushels of corn in May. The spot price of corn is 381 cents per bushel and the June futures price is 399 cents per bushel.
The corn chip manufacturer wants to use the June corn futures contracts to hedge his risk. Each futures contract is for the delivery of 5,000 bushels of corn. One bushel is about 127 metric tons.
How many corn futures should the corn chip manufacturer buy to hedge his risk? Round your answer to the nearest whole number of contracts. Remember to tail the hedge.
You intend to use futures on oil to hedge the risk of purchasing oil. There is no cross-hedging risk. Oil pays no dividends but it’s costly to store. Which of the following statements about basis risk in this scenario is NOT correct?
Question 693 boot strapping zero coupon yield, forward interest rate, term structure of interest rates
Information about three risk free Government bonds is given in the table below.
| Federal Treasury Bond Data | ||||
| Maturity | Yield to maturity | Coupon rate | Face value | Price |
| (years) | (pa, compounding semi-annually) | (pa, paid semi-annually) | ($) | ($) |
| 0.5 | 3% | 4% | 100 | 100.4926 |
| 1 | 4% | 4% | 100 | 100.0000 |
| 1.5 | 5% | 4% | 100 | 98.5720 |
Based on the above government bonds' yields to maturity, which of the below statements about the spot zero rates and forward zero rates is NOT correct?