A stock is expected to pay its semi-annual dividend of $1 per share for the foreseeable future. The current stock price is $40 and the continuously compounded risk free rate is 3% pa for all maturities. An investor has just taken a long position in a 12-month futures contract on the stock. The last dividend payment was exactly 4 months ago. Therefore the next $1 dividend is in 2 months, and the $1 dividend after is 8 months from now. Which of the following statements about this scenario is NOT correct?
Which of the following statements about futures contracts on shares is NOT correct, assuming that markets are efficient?
When an equity future is first negotiated (at t=0):
A stock is expected to pay a dividend of $5 per share in 1 month and $5 again in 7 months.
The stock price is $100, and the risk-free rate of interest is 10% per annum with continuous compounding. The yield curve is flat. Assume that investors are risk-neutral.
An investor has just taken a short position in a one year forward contract on the stock.
Find the forward price ##(F_1)## and value of the contract ##(V_0)## initially. Also find the value of the short futures contract in 6 months ##(V_\text{0.5, SF})## if the stock price fell to $90.
Question 432 option, option intrinsic value, no explanation
An American style call option with a strike price of ##K## dollars will mature in ##T## years. The underlying asset has a price of ##S## dollars.
What is an expression for the current intrinsic value in dollars from owning (being long) the American style call option? Note that the intrinsic value of an option does not subtract the premium paid to buy the option.
Question 584 option, option payoff at maturity, option profit
Which of the following statements about European call options on non-dividend paying stocks is NOT correct?
Question 271 CAPM, option, risk, systematic risk, systematic and idiosyncratic risk
All things remaining equal, according to the capital asset pricing model, if the systematic variance of an asset increases, its required return will increase and its price will decrease.
If the idiosyncratic variance of an asset increases, its price will be unchanged.
What is the relationship between the price of a call or put option and the total, systematic and idiosyncratic variance of the underlying asset that the option is based on? Select the most correct answer.
Call and put option prices increase when the:
You intend to use futures on oil to hedge the risk of purchasing oil. There is no cross-hedging risk. Oil pays no dividends but it’s costly to store. Which of the following statements about basis risk in this scenario is NOT correct?
An equity index is currently at 4,800 points. The 1.5 year futures price is 5,100 points and the total required return is 6% pa with continuous compounding. Each index point is worth $25.
What is the implied dividend yield as a continuously compounded rate per annum?
A put option written on a risky non-dividend paying stock will mature in one month. As is normal, assume that the option's exercise price is non-zero and positive ##(K>0)## and the stock has limited liability ##(S>0)##.
Which of the following statements is NOT correct? The put option's:
What derivative position are you exposed to if you have the obligation to sell the underlying asset at maturity, so you will definitely be forced to sell the underlying asset?
When does a European option's last-traded market price become a sunk cost?
Question 829 option, future, delta, gamma, theta, no explanation
Below are some statements about futures and European-style options on non-dividend paying stocks. Assume that the risk free rate is always positive. Which of these statements is NOT correct? All other things remaining equal:
A 12 month European-style call option with a strike price of $11 is written on a dividend paying stock currently trading at $10. The dividend is paid annually and the next dividend is expected to be $0.40, paid in 9 months. The risk-free interest rate is 5% pa continuously compounded and the standard deviation of the stock’s continuously compounded returns is 30 percentage points pa. The stock's continuously compounded returns are normally distributed. Using the Black-Scholes-Merton option valuation model, determine which of the following statements is NOT correct.
Question 834 option, delta, theta, gamma, standard deviation, Black-Scholes-Merton option pricing
Which of the following statements about an option (either a call or put) and its underlying stock is NOT correct?
| European Call Option | ||
| on a non-dividend paying stock | ||
| Description | Symbol | Quantity |
| Spot price ($) | ##S_0## | 20 |
| Strike price ($) | ##K_T## | 18 |
| Risk free cont. comp. rate (pa) | ##r## | 0.05 |
| Standard deviation of the stock's cont. comp. returns (pa) | ##\sigma## | 0.3 |
| Option maturity (years) | ##T## | 1 |
| Call option price ($) | ##c_0## | 3.939488 |
| Delta | ##\Delta = N[d_1]## | 0.747891 |
| ##N[d_2]## | ##N[d_2]## | 0.643514 |
| Gamma | ##\Gamma## | 0.053199 |
| Theta ($/year) | ##\Theta = \partial c / \partial T## | 1.566433 |
A stock, a call, a put and a bond are available to trade. The call and put options' underlying asset is the stock they and have the same strike prices, ##K_T##.
You are currently long the stock. You want to hedge your long stock position without actually trading the stock. How would you do this?
A one year European-style put option has a strike price of $4.
The option's underlying stock currently trades at $5, pays no dividends and its standard deviation of continuously compounded returns is 47% pa.
The risk-free interest rate is 10% pa continuously compounded.
Use the Black-Scholes-Merton formula to calculate the option price. The put option price now is:
If a variable, say X, is normally distributed with mean ##\mu## and variance ##\sigma^2## then mathematicians write ##X \sim \mathcal{N}(\mu, \sigma^2)##.
If a variable, say Y, is log-normally distributed and the underlying normal distribution has mean ##\mu## and variance ##\sigma^2## then mathematicians write ## Y \sim \mathbf{ln} \mathcal{N}(\mu, \sigma^2)##.
The below three graphs show probability density functions (PDF) of three different random variables Red, Green and Blue.
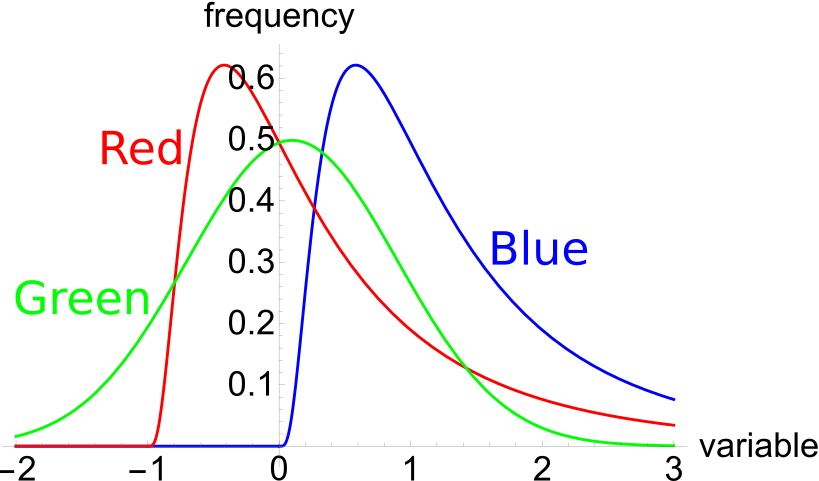
Select the most correct statement:
Question 722 mean and median returns, return distribution, arithmetic and geometric averages, continuously compounding rate
Here is a table of stock prices and returns. Which of the statements below the table is NOT correct?
| Price and Return Population Statistics | ||||
| Time | Prices | LGDR | GDR | NDR |
| 0 | 100 | |||
| 1 | 50 | -0.6931 | 0.5 | -0.5 |
| 2 | 100 | 0.6931 | 2 | 1 |
| Arithmetic average | 0 | 1.25 | 0.25 | |
| Arithmetic standard deviation | 0.9802 | 1.0607 | 1.0607 | |
Question 792 mean and median returns, return distribution, arithmetic and geometric averages, continuously compounding rate, log-normal distribution, confidence interval
A risk manager has identified that their investment fund’s continuously compounded portfolio returns are normally distributed with a mean of 10% pa and a standard deviation of 40% pa. The fund’s portfolio is currently valued at $1 million. Assume that there is no estimation error in the above figures. To simplify your calculations, all answers below use 2.33 as an approximation for the normal inverse cumulative density function at 99%. All answers are rounded to the nearest dollar. Assume one month is 1/12 of a year. Which of the following statements is NOT correct?
Question 925 mean and median returns, return distribution, arithmetic and geometric averages, continuously compounding rate, no explanation
The arithmetic average and standard deviation of returns on the ASX200 accumulation index over the 24 years from 31 Dec 1992 to 31 Dec 2016 were calculated as follows:
###\bar{r}_\text{yearly} = \dfrac{ \displaystyle\sum\limits_{t=1992}^{24}{\left( \ln \left( \dfrac{P_{t+1}}{P_t} \right) \right)} }{T} = \text{AALGDR} =0.0949=9.49\% \text{ pa}###
###\sigma_\text{yearly} = \dfrac{ \displaystyle\sum\limits_{t=1992}^{24}{\left( \left( \ln \left( \dfrac{P_{t+1}}{P_t} \right) - \bar{r}_\text{yearly} \right)^2 \right)} }{T} = \text{SDLGDR} = 0.1692=16.92\text{ pp pa}###
Assume that the log gross discrete returns are normally distributed and that the above estimates are true population statistics, not sample statistics, so there is no standard error in the sample mean or standard deviation estimates. Also assume that the standardised normal Z-statistic corresponding to a one-tail probability of 2.5% is exactly -1.96.
Which of the following statements is NOT correct? If you invested $1m today in the ASX200, then over the next 4 years:
Question 926 mean and median returns, return distribution, arithmetic and geometric averages, continuously compounding rate
The arithmetic average continuously compounded or log gross discrete return (AALGDR) on the ASX200 accumulation index over the 24 years from 31 Dec 1992 to 31 Dec 2016 is 9.49% pa.
The arithmetic standard deviation (SDLGDR) is 16.92 percentage points pa.
Assume that the log gross discrete returns are normally distributed and that the above estimates are true population statistics, not sample statistics, so there is no standard error in the sample mean or standard deviation estimates. Also assume that the standardised normal Z-statistic corresponding to a one-tail probability of 2.5% is exactly -1.96.
If you had a $1 million fund that replicated the ASX200 accumulation index, in how many years would the median dollar value of your fund first be expected to lie outside the 95% confidence interval forecast?
Question 927 mean and median returns, mode return, return distribution, arithmetic and geometric averages, continuously compounding rate
The arithmetic average continuously compounded or log gross discrete return (AALGDR) on the ASX200 accumulation index over the 24 years from 31 Dec 1992 to 31 Dec 2016 is 9.49% pa.
The arithmetic standard deviation (SDLGDR) is 16.92 percentage points pa.
Assume that the log gross discrete returns are normally distributed and that the above estimates are true population statistics, not sample statistics, so there is no standard error in the sample mean or standard deviation estimates. Also assume that the standardised normal Z-statistic corresponding to a one-tail probability of 2.5% is exactly -1.96.
If you had a $1 million fund that replicated the ASX200 accumulation index, in how many years would the mean dollar value of your fund first be expected to lie outside the 95% confidence interval forecast?
Question 928 mean and median returns, mode return, return distribution, arithmetic and geometric averages, continuously compounding rate, no explanation
The arithmetic average continuously compounded or log gross discrete return (AALGDR) on the ASX200 accumulation index over the 24 years from 31 Dec 1992 to 31 Dec 2016 is 9.49% pa.
The arithmetic standard deviation (SDLGDR) is 16.92 percentage points pa.
Assume that the log gross discrete returns are normally distributed and that the above estimates are true population statistics, not sample statistics, so there is no standard error in the sample mean or standard deviation estimates. Also assume that the standardised normal Z-statistic corresponding to a one-tail probability of 2.5% is exactly -1.96.
If you had a $1 million fund that replicated the ASX200 accumulation index, in how many years would the mode dollar value of your fund first be expected to lie outside the 95% confidence interval forecast?
Note that the mode of a log-normally distributed future price is: ##P_{T \text{ mode}} = P_0.e^{(\text{AALGDR} - \text{SDLGDR}^2 ).T} ##
Question 785 fixed for floating interest rate swap, non-intermediated swap
The below table summarises the borrowing costs confronting two companies A and B.
| Bond Market Yields | ||||
| Fixed Yield to Maturity (%pa) | Floating Yield (%pa) | |||
| Firm A | 3 | L - 0.4 | ||
| Firm B | 5 | L + 1 | ||
Firm A wishes to borrow at a floating rate and Firm B wishes to borrow at a fixed rate. Design a non-intermediated swap that benefits firm A only. What will be the swap rate?
A company can invest funds in a five year project at LIBOR plus 50 basis points pa. The five-year swap rate is 4% pa. What fixed rate of interest can the company earn over the next five years by using the swap?
Question 948 VaR, expected shortfall
Below is a historical sample of returns on the S&P500 capital index.
| S&P500 Capital Index Daily Returns Ranked from Best to Worst |
||
| 10,000 trading days from 4th August 1977 to 24 March 2017 based on closing prices. |
||
| Rank | Date (DD-MM-YY) |
Continuously compounded daily return (% per day) |
| 1 | 21-10-87 | 9.23 |
| 2 | 08-03-83 | 8.97 |
| 3 | 13-11-08 | 8.3 |
| 4 | 30-09-08 | 8.09 |
| 5 | 28-10-08 | 8.01 |
| 6 | 29-10-87 | 7.28 |
| … | … | … |
| 9980 | 11-12-08 | -5.51 |
| 9981 | 22-10-08 | -5.51 |
| 9982 | 08-08-11 | -5.54 |
| 9983 | 22-09-08 | -5.64 |
| 9984 | 11-09-86 | -5.69 |
| 9985 | 30-11-87 | -5.88 |
| 9986 | 14-04-00 | -5.99 |
| 9987 | 07-10-98 | -6.06 |
| 9988 | 08-01-88 | -6.51 |
| 9989 | 27-10-97 | -6.55 |
| 9990 | 13-10-89 | -6.62 |
| 9991 | 15-10-08 | -6.71 |
| 9992 | 29-09-08 | -6.85 |
| 9993 | 07-10-08 | -6.91 |
| 9994 | 14-11-08 | -7.64 |
| 9995 | 01-12-08 | -7.79 |
| 9996 | 29-10-08 | -8.05 |
| 9997 | 26-10-87 | -8.4 |
| 9998 | 31-08-98 | -8.45 |
| 9999 | 09-10-08 | -12.9 |
| 10000 | 19-10-87 | -23.36 |
| Mean of all 10,000: | 0.0354 | |
| Sample standard deviation of all 10,000: | 1.2062 | |
| Sources: Bloomberg and S&P. | ||
Assume that the one-tail Z-statistic corresponding to a probability of 99.9% is exactly 3.09. Which of the following statements is NOT correct? Based on the historical data, the 99.9% daily:
Question 956 option, Black-Scholes-Merton option pricing, delta hedging, hedging
A bank sells a European call option on a non-dividend paying stock and delta hedges on a daily basis. Below is the result of their hedging, with columns representing consecutive days. Assume that there are 365 days per year and interest is paid daily in arrears.
| Delta Hedging a Short Call using Stocks and Debt | |||||||
| Description | Symbol | Days to maturity (T in days) | |||||
| 60 | 59 | 58 | 57 | 56 | 55 | ||
| Spot price ($) | S | 10000 | 10125 | 9800 | 9675 | 10000 | 10000 |
| Strike price ($) | K | 10000 | 10000 | 10000 | 10000 | 10000 | 10000 |
| Risk free cont. comp. rate (pa) | r | 0.05 | 0.05 | 0.05 | 0.05 | 0.05 | 0.05 |
| Standard deviation of the stock's cont. comp. returns (pa) | σ | 0.4 | 0.4 | 0.4 | 0.4 | 0.4 | 0.4 |
| Option maturity (years) | T | 0.164384 | 0.161644 | 0.158904 | 0.156164 | 0.153425 | 0.150685 |
| Delta | N[d1] = dc/dS | 0.552416 | 0.582351 | 0.501138 | 0.467885 | 0.550649 | 0.550197 |
| Probability that S > K at maturity in risk neutral world | N[d2] | 0.487871 | 0.51878 | 0.437781 | 0.405685 | 0.488282 | 0.488387 |
| Call option price ($) | c | 685.391158 | 750.26411 | 567.990995 | 501.487157 | 660.982878 | ? |
| Stock investment value ($) | N[d1]*S | 5524.164129 | 5896.301781 | 4911.152036 | 4526.788065 | 5506.488143 | ? |
| Borrowing which partly funds stock investment ($) | N[d2]*K/e^(r*T) | 4838.772971 | 5146.037671 | 4343.161041 | 4025.300909 | 4845.505265 | ? |
| Interest expense from borrowing paid in arrears ($) | r*N[d2]*K/e^(r*T) | 0.662891 | 0.704985 | 0.594994 | 0.551449 | ? | |
| Gain on stock ($) | N[d1]*(SNew - SOld) | 69.052052 | -189.264008 | -62.642245 | 152.062648 | ? | |
| Gain on short call option ($) | -1*(cNew - cOld) | -64.872952 | 182.273114 | 66.503839 | -159.495721 | ? | |
| Net gain ($) | Gains - InterestExpense | 3.516209 | -7.695878 | 3.266599 | -7.984522 | ? | |
| Gamma | Γ = d^2c/dS^2 | 0.000244 | 0.00024 | 0.000255 | 0.00026 | 0.000253 | 0.000255 |
| Theta | θ = dc/dT | 2196.873429 | 2227.881353 | 2182.174706 | 2151.539751 | 2266.589184 | 2285.1895 |
In the last column when there are 55 days left to maturity there are missing values. Which of the following statements about those missing values is NOT correct?